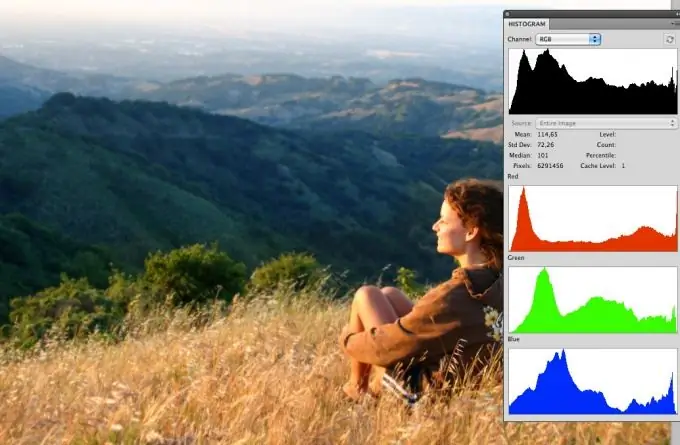
Any serious photo editor has a histogram viewer, a tool that allows you to pinpoint the specific light characteristics of an image. Also in professional models of cameras it is possible to display it on the screen, which makes it possible to immediately select the optimal shooting parameters. For a beginner, this graph seems completely incomprehensible, but there is nothing complicated, and you can easily verify this.

Instructions
Step 1
If you are using a program for processing photos of the Adobe Photoshop family, pay attention to the Histogram / Histogram palette on the right side of the working window. If it is not there, click the Window button and select the Histogram item. You can choose one of the display options: compact, extended or display mode for all color channels.
Step 2
The histogram is a small window with a wave-like shaded graph that resembles mountains. The graph displays the number of pixels in different tonal areas. On the left is the area of shadows, dark tones. The center part determines the number of halftones in the image. The right side of the histogram shows the saturation of the picture with light tones.
Step 3
To adjust, go to Image> Adjustments> Levels. Check the box Preview, then you can see the result of changes without closing the Levels window. Use the sliders at the bottom of the interactive graph. There are three of them: black, gray and white. Each is responsible for the corresponding area of tones.
Step 4
High peaks on the left side of the graph indicate that there are too many dark pixels and the image is therefore too dark. Moving the black slider to the right makes the image even darker. To lighten it, move the white slider to the left. If you are using a camera, increase the exposure.
Step 5
The full-width columns on the right side indicate a large number of bright pixels, which leads to the "overexposure" of the picture. Decrease the exposure (for the camera), move the black slider to the right, or lower the contrast value of the picture in Photoshop.
Step 6
The peaks in the middle of the picture usually do not need to be corrected. But if you move the middle slider towards dark, then the middle tones will lighten, and vice versa. Proceed at your own discretion.
Step 7
If there are no pixels on the histogram in the extreme areas, then you can "cut off" parts from the edges of the histogram (the leftmost and rightmost parts), that is, move the sliders to the part where the pixels begin. This one action will already lead to an increase in the contrast and vividness of the image.
Step 8
Remember, there is no such thing as a perfect histogram. A snapshot of a night landscape will naturally have a graph shifted to the left, and a winter scene with an abundance of snow will show an abundance of peaks on the right. Use the data on the content of tones in the image as a reference when building a composition or editing ready-made photographs.


